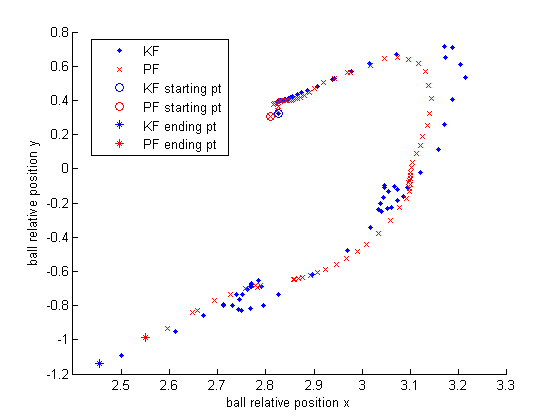
First plot, ball moving trajetory.
Second plot, the x-y error on a 2D plot.
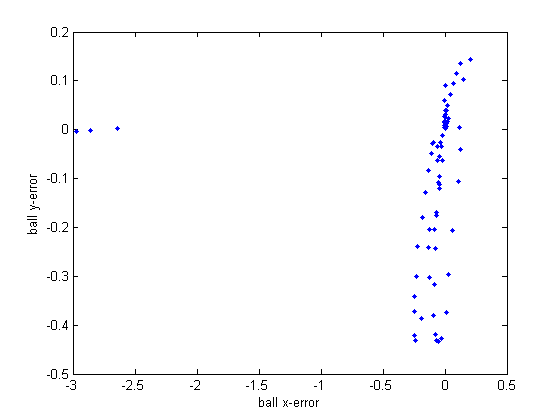
Note that in the above plot, we do not remove those cases when the ball is not in observation. When the ball is not visible,
vision.balls.objects[0].relpos.x = 0;
vision.balls.objects[0].relpos.y = last_y;
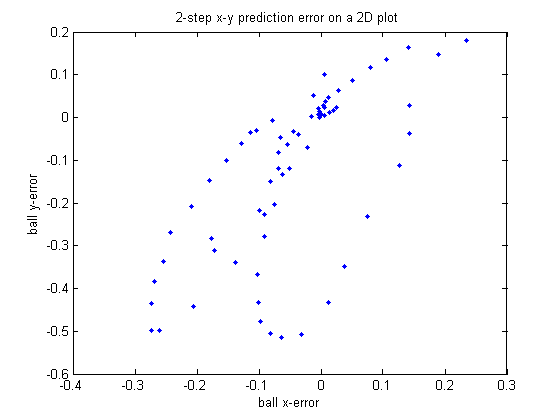
This will cause a big error between the prediction and the assumed observation. So this does not indicate a bad prediction at all. I removed those points and get the following plot.
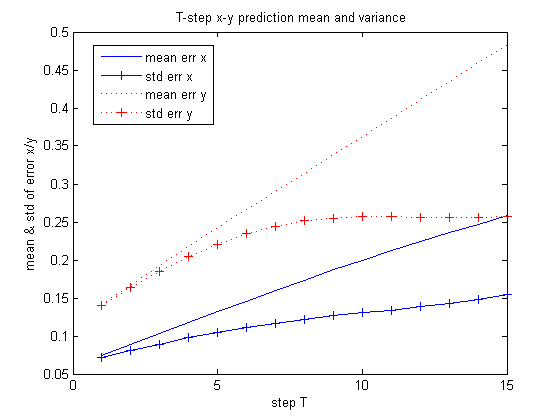
When we change the prediction step T, the following plot shows how the mean and variance change.